Pizza Sales Dashboard | SQL & Power BI
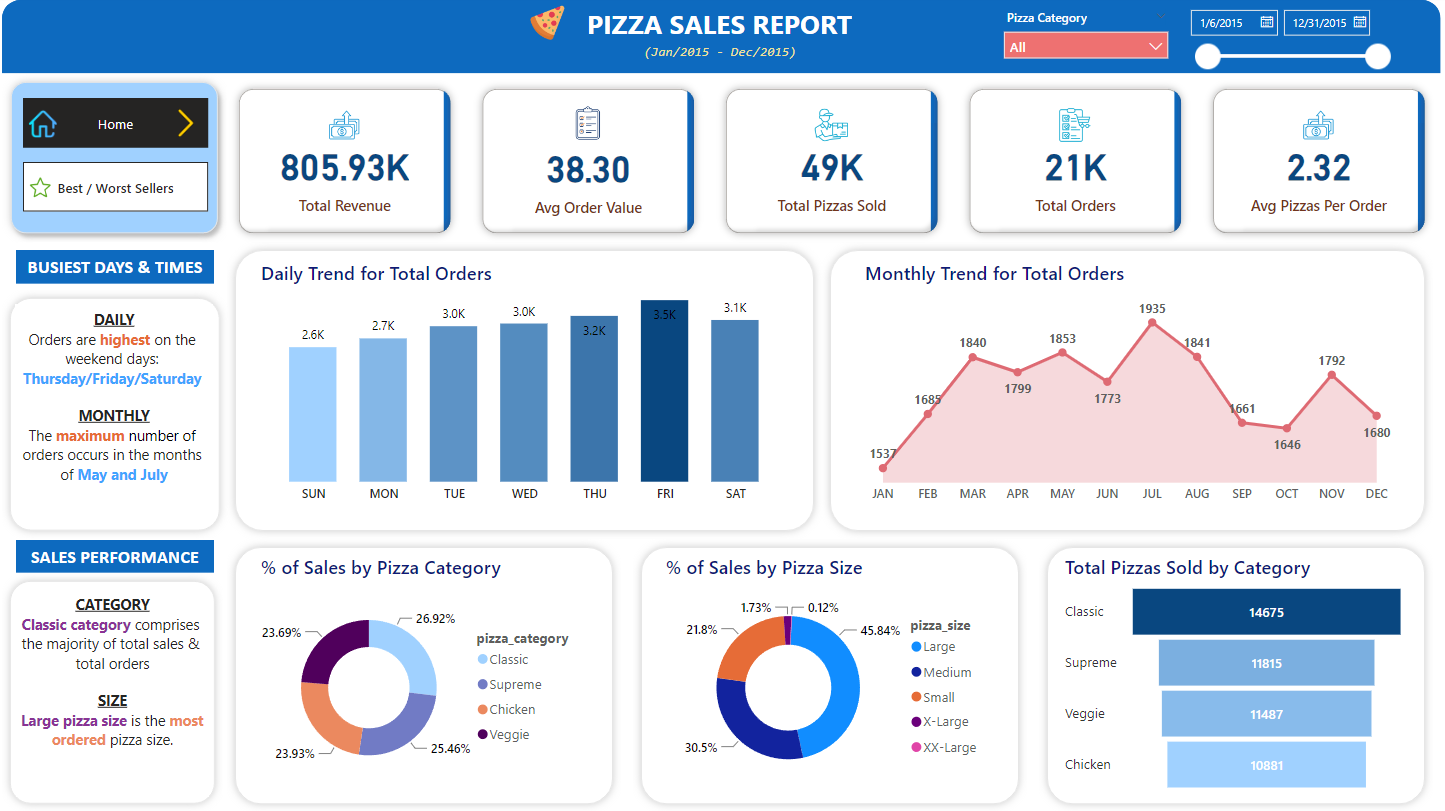
Utilizing SQL and Power BI, this project involved data cleansing and transformation to analyze key metrics and visualize trends, ultimately providing actionable insights for the pizza company’s sales performance over the past year.
Sales Management Dashboard | SQL & Power BI
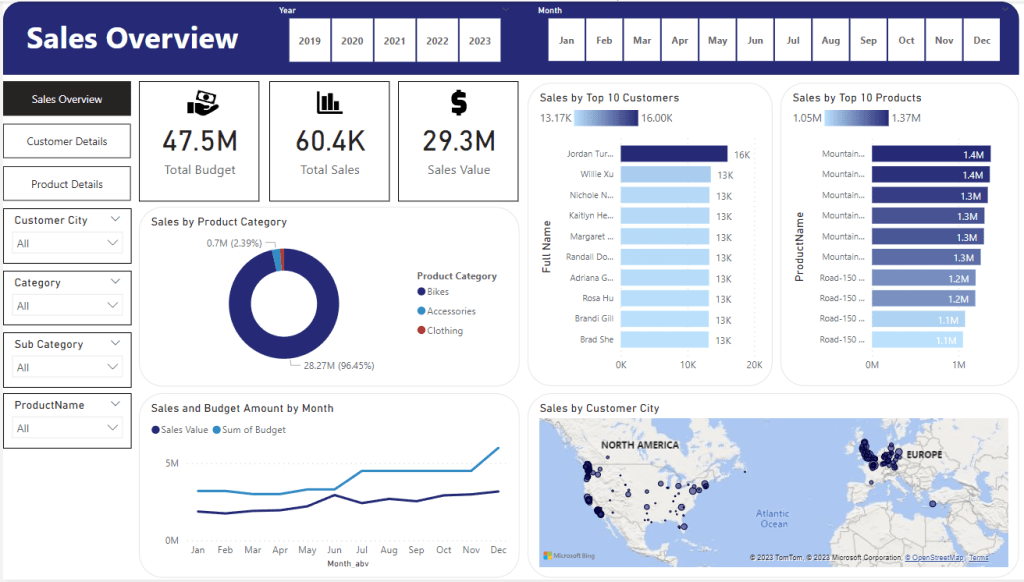
This project showcased the creation of dynamic visual dashboards, leveraging SQL extensively to integrate data from multiple sources. These daily-updating Power BI dashboards provided invaluable insights into customer, product, and budget performance for sales managers.
Bike Sharing Analysis | R Studio & Data Visualization
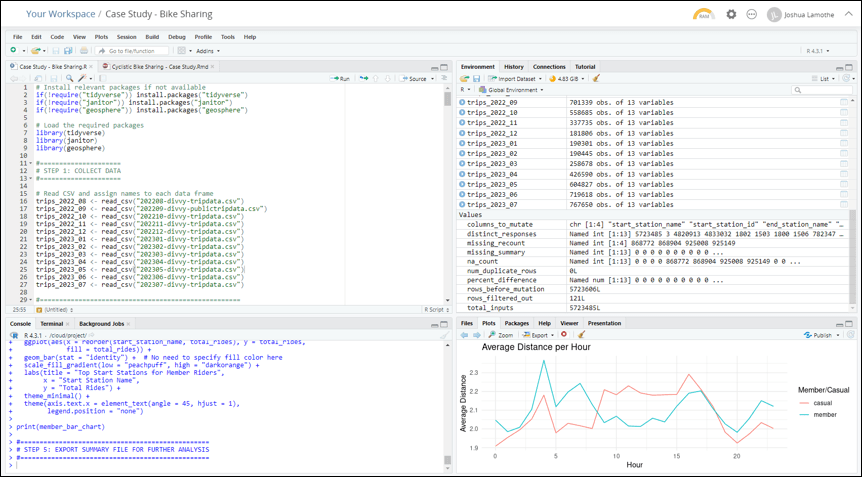
The primary focus of the analysis was to discern the differences between members and casual riders by exploring ride durations, times, and frequency patterns. This allowed for targeted marketing and membership strategy recommendations based on these distinctions.
Orders Dashboard | Looker Studio & Data Visualization

This project showcased the creation of an interactive sales dashboard in Looker Studio, using a cleaned Excel dataset to visualize key metrics across customers, products, regions, and time periods. The dashboard enables dynamic filtering and drill‑downs, providing actionable insights into sales trends, profitability, and performance for business stakeholders.
