Case study · SQL & Power BI
Pizza Sales Analytics
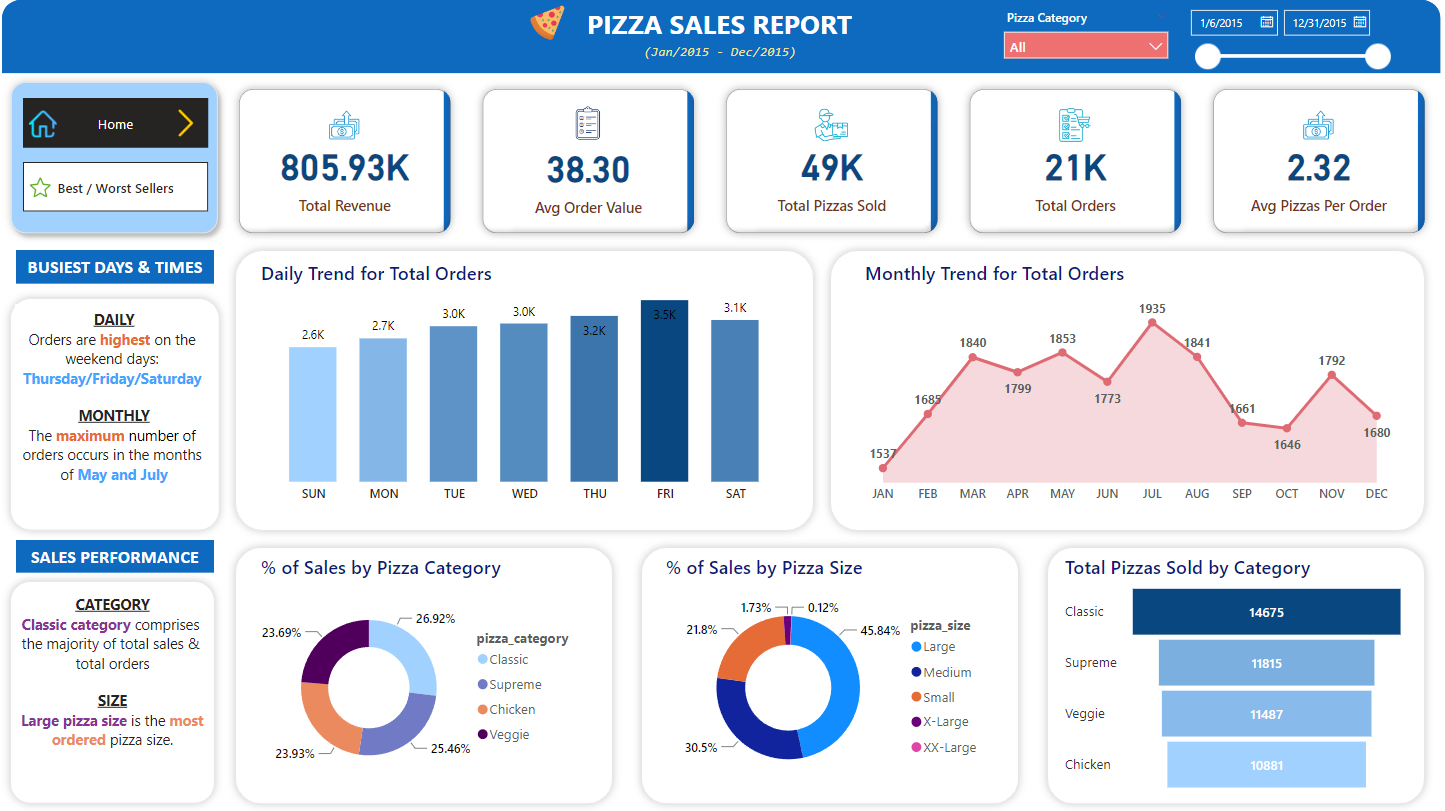
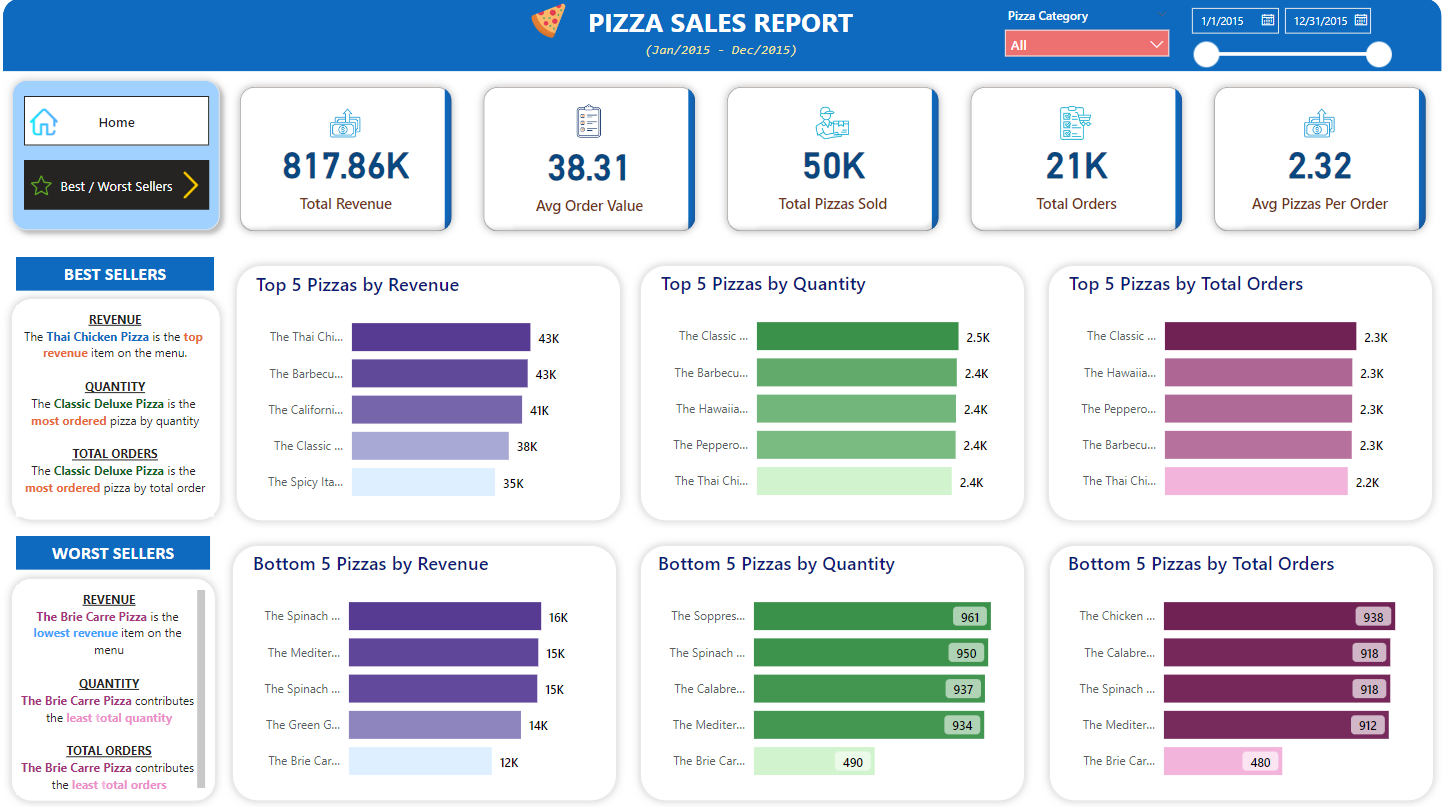
A two-page Power BI report on a full year of pizza orders, built to show what sells, when it sells, and which items underperform. Every KPI was calculated in SQL first, then built out in Power BI.
$817.9KTotal revenue
21KOrders
50KPizzas sold
$38.31Average order
The ask
The business wanted a clear read on last year’s sales: five core KPIs (revenue, average order value, pizzas sold, orders and pizzas per order), order patterns by day and month, the sales mix by category and size, and a list of the best and worst selling pizzas.
How I built it
- Step 1Queried the data in SQLLoaded the order data into SQL Server and wrote a query for every KPI and chart requirement.
- Step 2Built the report in Power BIA home overview plus a best and worst sellers page, with category and date filters on both.
- Step 3Called out the answersAdded short text panels so the key takeaways read at a glance, without digging through charts.
What the data showed
- Friday is the busiest day and July is the busiest month, with 1,935 orders.
- Classic pizzas lead the menu at 26.9% of sales, and large pizzas make up 45.8% of sales.
- The Thai Chicken pizza earns the most, while the Classic Deluxe sells the most units.
- The Brie Carre finishes last on revenue, quantity and orders, making it the clearest candidate to cut.
The SQL
Each dashboard figure started as a query. The full set is below.
Show the SQL
Total Revenue

SELECT SUM(total_price) AS Total_Revenue

FROM pizza_sales;

Average Order Value

SELECT max(order_id) AS Total_Orders, SUM(total_price) AS Total_Revenue, SUM(total_price) / max(order_id) AS Average_Order_Value

FROM pizza_sales;

Total Pizzas Sold

SELECT SUM(quantity)

FROM pizza_sales;

Total Orders (Two methods shown to confirm)

SELECT COUNT(DISTINCT order_id) AS 'distinct', MAX(order_id) AS max

FROM pizza_sales;

Average Pizzas Per Order

SELECT CAST(CAST(SUM(quantity) AS DECIMAL(10,2)) / CAST(MAX(order_id) AS DECIMAL(10,2)) AS DECIMAL(10,2)) AS avg_pizzas_ordered

FROM pizza_sales;

Daily Trend for Total Orders

SELECT DATENAME(weekday, order_date) as order_day, COUNT(DISTINCT order_id) AS total_orders

FROM pizza_sales

GROUP BY DATENAME(weekday, order_date)

ORDER BY total_orders DESC;

Monthly Trend for Total Orders

SELECT DATENAME(month, order_date) as order_day, COUNT(DISTINCT order_id) AS total_orders

FROM pizza_sales

GROUP BY DATENAME(month, order_date)

ORDER BY total_orders DESC;

Percentage of Sales by Pizza Category

SELECT pizza_category, SUM(total_price) AS total_sales, Sum(total_price) * 100 / (SELECT sum(total_price) FROM pizza_sales WHERE MONTH(order_date) = 1) AS 'percent'

FROM pizza_sales

WHERE MONTH(order_date) = 1

GROUP BY pizza_category;

Percentage of Sales by Pizza Size

SELECT pizza_size, SUM(total_price) AS total_sales, SUM(total_price) * 100 / (SELECT SUM(total_price) FROM pizza_sales) AS 'percent'

FROM pizza_sales

GROUP BY pizza_size

ORDER BY 'percent' DESC;

Total Pizzas Sold by Pizza Category

SELECT pizza_category, COUNT(quantity) AS pizzas_sold

FROM pizza_sales

GROUP BY pizza_category;

Top 5 Best Sellers by Revenue

SELECT TOP 5 pizza_name, sum(total_price) AS revenue

FROM pizza_sales

GROUP BY pizza_name

ORDER BY revenue DESC;

Bottom 5 Best Sellers by Revenue

SELECT TOP 5 pizza_name, sum(total_price) AS revenue

FROM pizza_sales

GROUP BY pizza_name

ORDER BY revenue ASC;

Top 5 Best Sellers by Total Quantity

SELECT TOP 5 pizza_name, sum(quantity) AS total_quantity

FROM pizza_sales

GROUP BY pizza_name

ORDER BY total_quantity DESC;

Bottom 5 Best Sellers by Total Quantity

SELECT TOP 5 pizza_name, sum(quantity) AS total_quantity

FROM pizza_sales

GROUP BY pizza_name

ORDER BY total_quantity ASC;

Top 5 Best Sellers by Total Orders

SELECT TOP 5 pizza_name, COUNT(DISTINCT order_id) AS total_orders

FROM pizza_sales

GROUP BY pizza_name

ORDER BY total_orders DESC;

Bottom 5 Best Sellers by Total Orders

SELECT TOP 5 pizza_name, COUNT(DISTINCT order_id) AS total_orders

FROM pizza_sales

GROUP BY pizza_name

ORDER BY total_orders DESC;
Next projectBike-Share Rider Analysis →
Get in touch
