Case study · SQL & Power BI
Sales Management Dashboard
A three-page Power BI report that moved a sales team from static reports to an interactive dashboard, so managers can track internet sales against budget and drill into any customer or product.
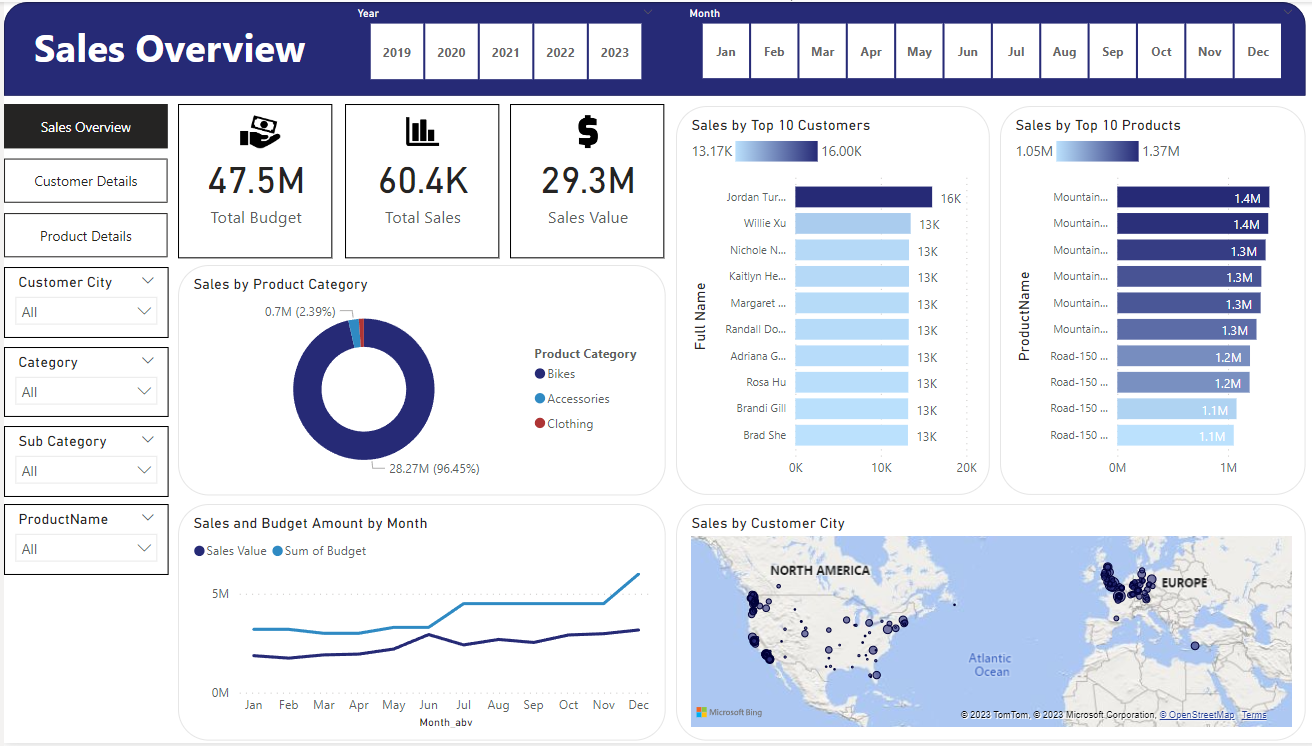
$29.3MSales value
$47.5MBudget
606Products
3Report pages
The ask
The sales manager asked to replace static internet sales reports with visual dashboards: what sold, to which customers, and how that changed over time. Reps needed to filter to their own customers and products, and every figure had to be measured against the 2021 budget, with at least two years of history.
Requirements
The request was broken into user stories, each with acceptance criteria the finished report had to meet.
| Role | Request | Value | Acceptance criteria |
|---|---|---|---|
| Sales Manager | Internet sales dashboard for customer and product insights | Analyze top-performing customers and products | Daily-updating Power BI dashboard |
| Sales Rep | Customer-level internet sales analysis | Identify high-value customers and upsell opportunities | Dashboard with customer filtering |
| Sales Rep | Product-level internet sales analysis | Track best-selling products | Dashboard with product filtering |
| Sales Manager | Sales overview with budget comparison | Monitor performance against budget | Graphs and KPIs compared to budget |
How I built it
- Step 1Cleaned the data in SQLWrote SQL in SQL Server Management Studio to pull and clean the date, customer, product and internet sales tables from Microsoft’s AdventureWorks sample database.
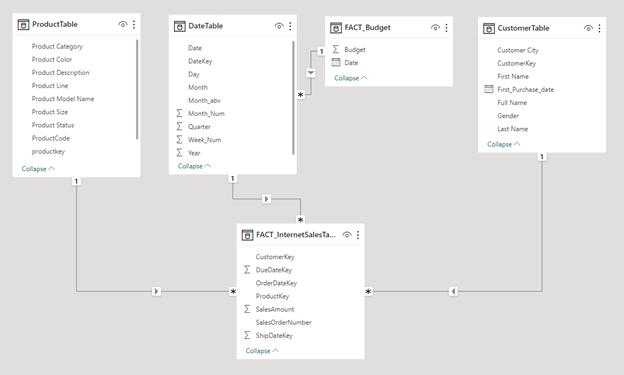
- Step 2Modeled it in Power BIBrought in the budget spreadsheet and built a star schema joining the internet sales and budget fact tables to shared date, customer and product dimensions.
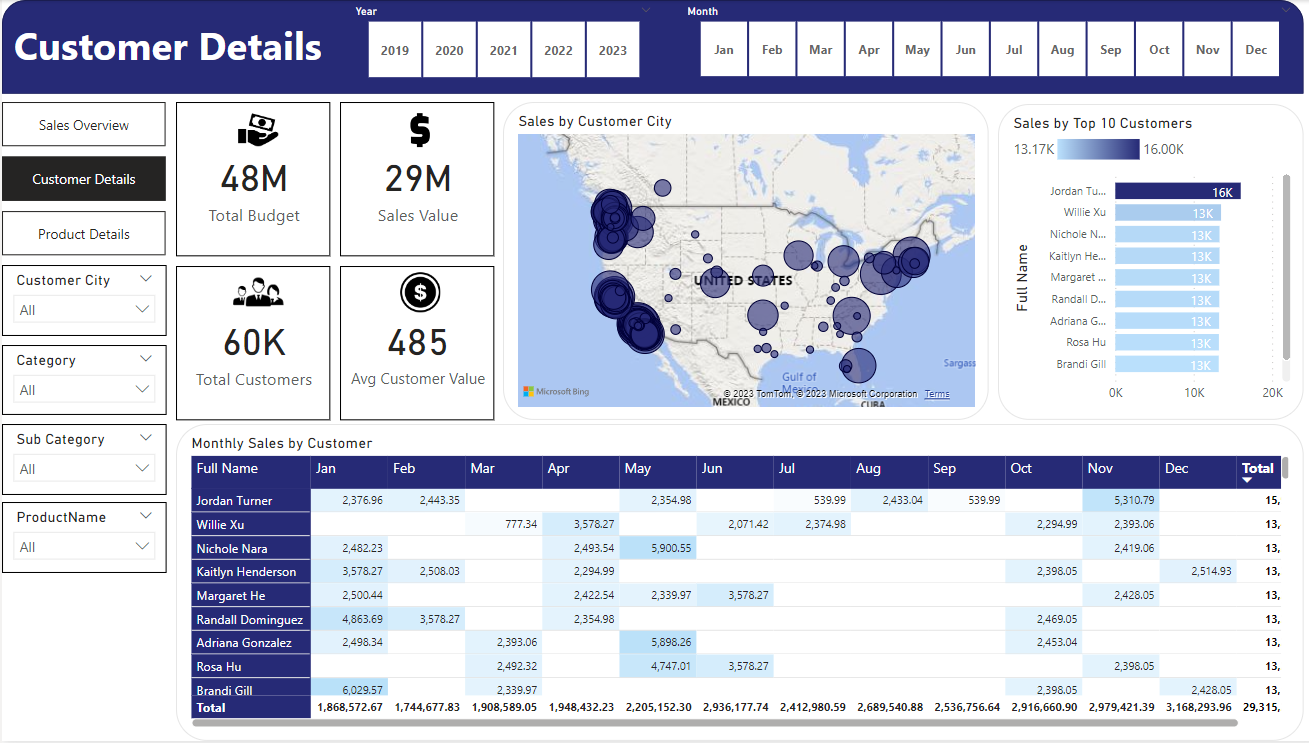
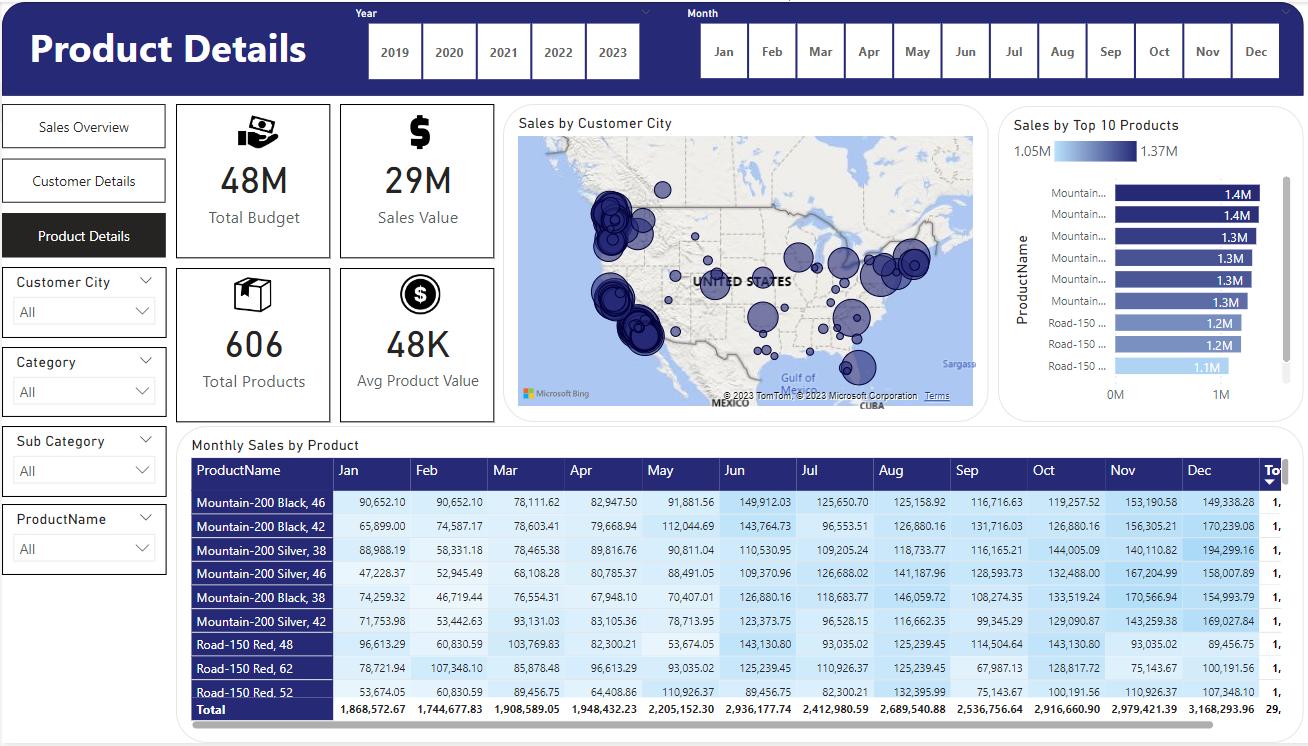
- Step 3Built the reportAn overview page that compares sales to budget, plus customer and product detail pages, all filterable by year, month, city, category and product.
What the report shows
- Bikes drive almost everything: 96.5% of sales value, with accessories and clothing under 4% combined.
- Mountain-200 models hold the top six product spots, at roughly $1.3M to $1.4M each.
- Sales tracked below budget every month, and the gap widened in the second half of the year as the budget stepped up.
- Customer spend is spread thin: the top customer spent about $16K, and the rest of the top ten sit near $13K.
The SQL
The queries that cleaned and shaped each table before it reached Power BI.
Show the SQL
--Cleaned DimDate Table--
SELECT Datekey,
       FullDateAlternateKey AS DATE,
       EnglishDayNameOfWeek AS Day,
       EnglishMonthName AS Month,
       LEFT(EnglishMonthName, 3) AS Month_abv,
       MonthNumberOfYear AS Month_Num,
       CalendarQuarter AS Quarter,
       CalendarYear AS Year
FROM dbo.DimDate
WHERE CalendarYear >= 2019;

--Cleaned DimCustomer Table--
SELECT
	c.CustomerKey AS CustomerKey,
	c.Firstname AS [First Name],
	c.Lastname AS [Last Name],
	c.FirstName + ' ' + c.LastName AS [Full Name],
	CASE c.gender
		WHEN 'm' THEN 'Male'
		WHEN 'f' THEN 'Female'
	END AS Gender,
	c.DateFirstPurchase AS First_Purchase_Date,
	g.city AS [Customer City]
FROM DimCustomer c
LEFT JOIN DimGeography g -- Joined city from Geography Table
	ON c.GeographyKey = g.geographykey
ORDER BY c.customerkey;

--Cleaned DimProduct Table--
SELECT
	p.productkey,
	p.ProductAlternateKey AS ProductCode,
	p.EnglishProductName AS ProductName,
	ps.EnglishProductSubcategoryName AS [Sub Category],
	pc.EnglishProductCategoryName AS [Product Category],
	p.color AS [Product Color],
	p.size AS [Product Size],
	p.ProductLine AS [Product Line],
	p.ModelName AS [Product Model Name],
	p.EnglishDescription AS [Product Description],
	ISNULL (p.Status, 'Outdated') AS [Product Status]
FROM
	DimProduct p
LEFT JOIN DimProductCategory pc
	ON p.EnglishProductName = pc.EnglishProductCategoryName
LEFT JOIN DimProductSubcategory ps
	ON p.ProductSubcategoryKey = ps.ProductSubcategoryKey
ORDER BY p.productkey;

--Cleaned FactInternetSales Table--
SELECT
	ProductKey,
	OrderDateKey,
	DueDateKey,
	ShipDateKey,
	CustomerKey,
	SalesOrderNumber,
	SalesAmount
FROM FactInternetSales
WHERE
	LEFT (OrderDateKey, 4) >= YEAR(GETDATE()) -3 -- Ensures only previous two years of data;
Next projectPizza Sales Analytics →
Get in touch
